
Visyn provides Integrated Dashboard Development and Data Visualization to bring your business intelligence data stores together in one place.
Imagine your Business Intelligence gathered into a single visual report so you can make decisions and organize your actions.
We can utilize Local and cloud based data sources to build any data view.
Combine your data into a single, easy to understand view and stop switching between applications or risking errors by interacting manually with Excel.
Focus on meaningful data and effectively track your Key Performance Indicators (KPIs). Use visualization to know which dimensions of your business generate revenue and keep attention on the actions that matter.
Data Visualization can reveal nuanced intelligence from any number of sources and for many business needs.
Markets
- Marketing
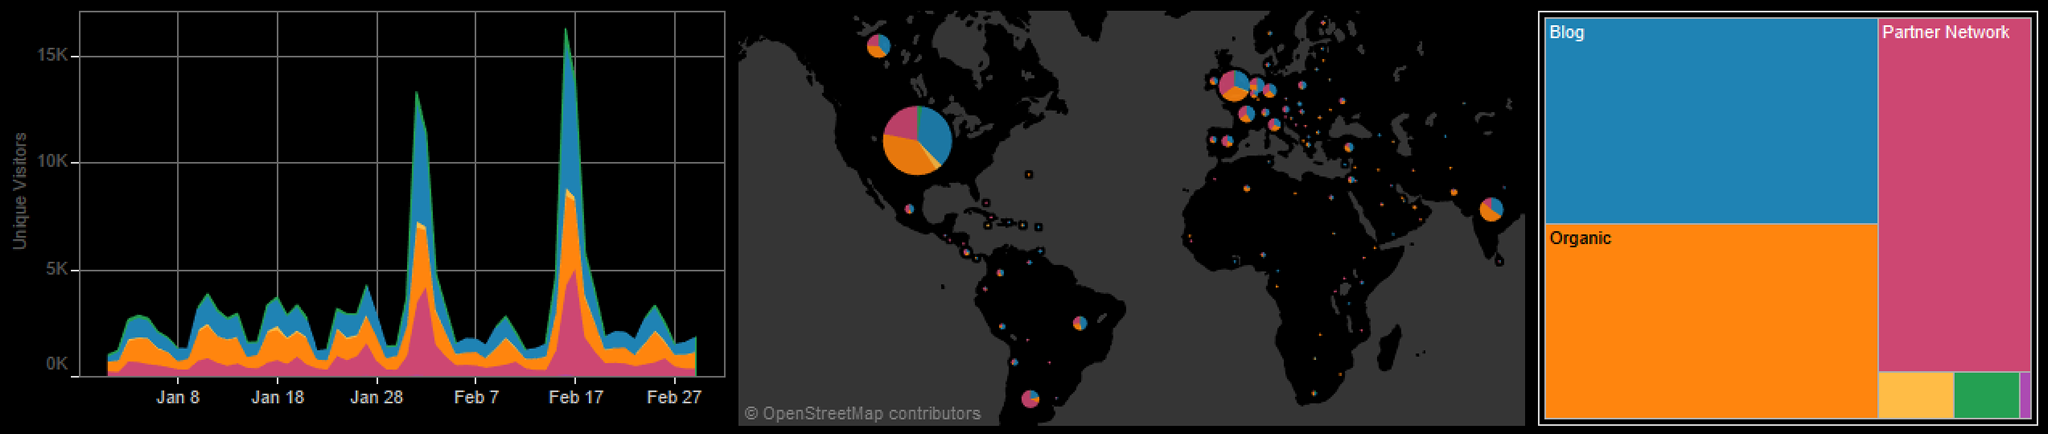
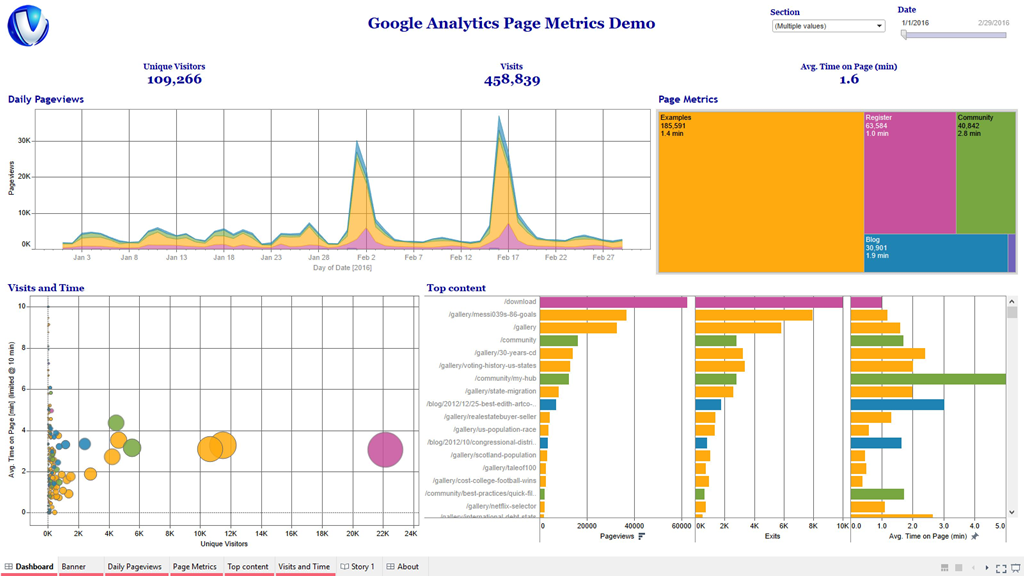
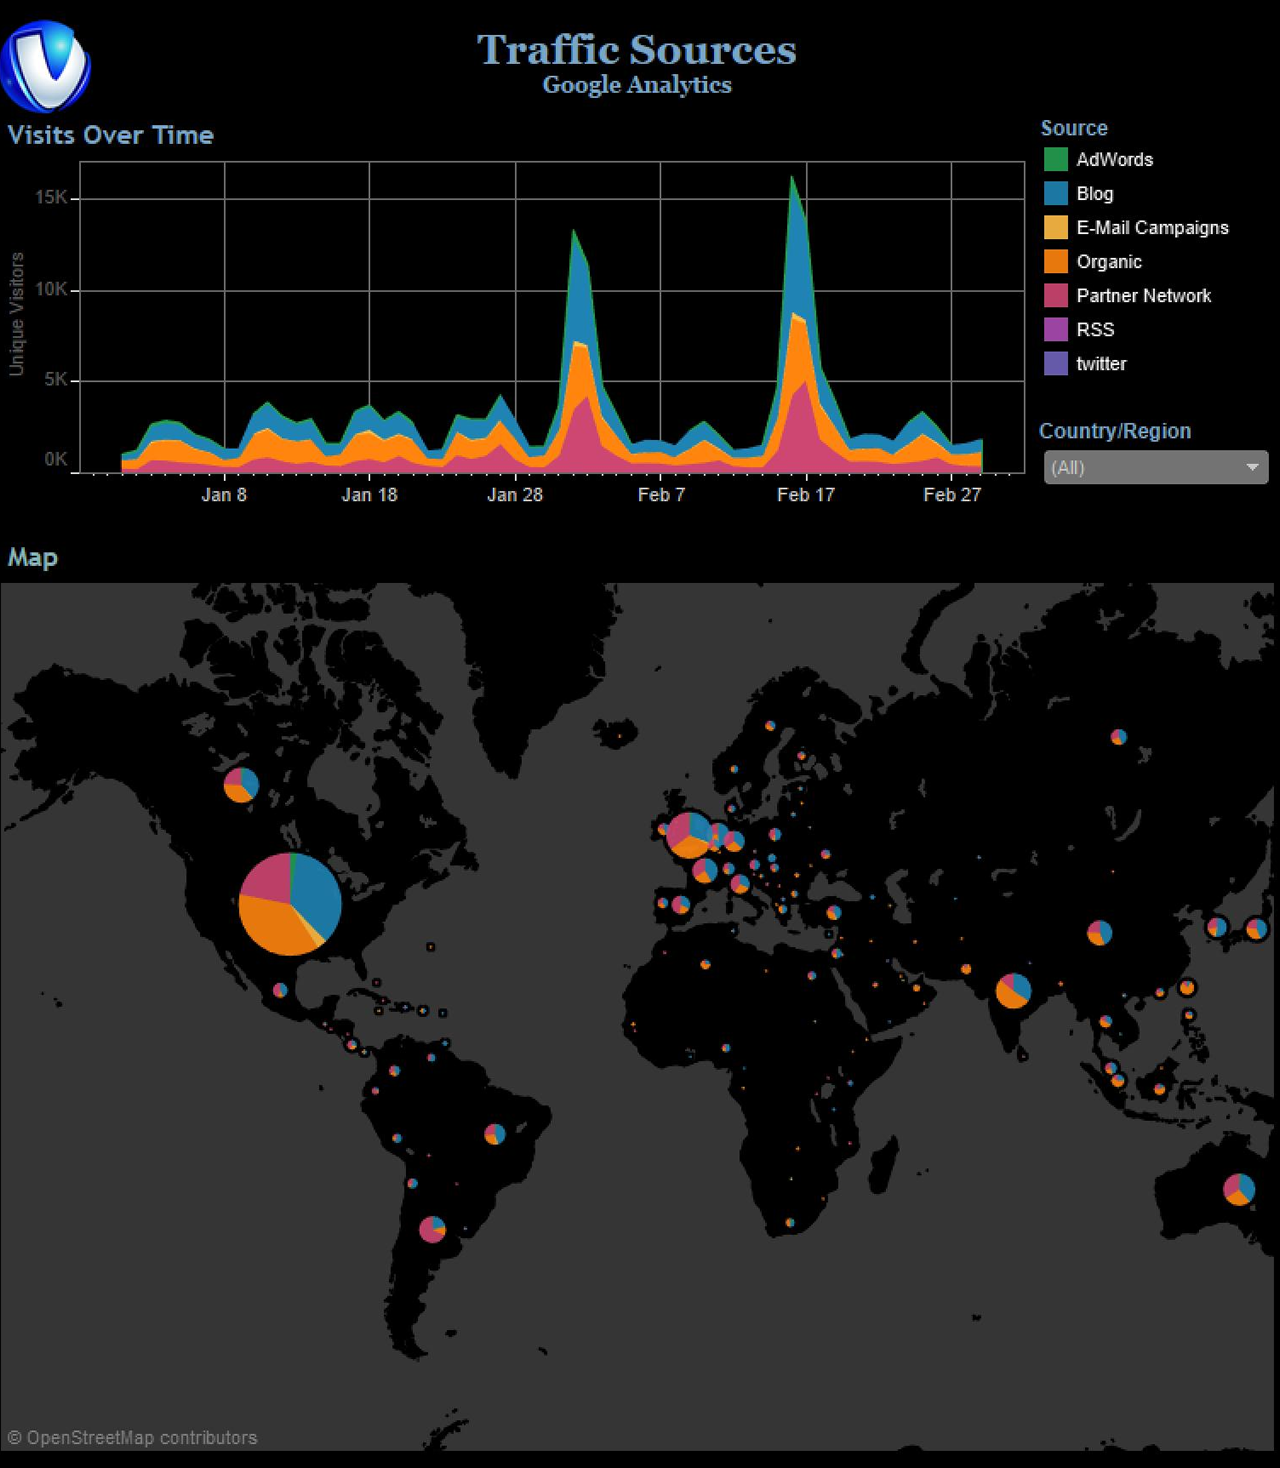
- Combine multiple data streams into dashboards to get a quick overview of your marketing efforts.
- Side by side comparison of key performance indicators.
- Visualize marketing campaign performance and ROI
- Correlate marketing efforts to actual leads generated and sales closed
- Isolate regional and seasonal market trends
- Sales
- Get visual access to Sales data from Salesforce or alternative CRM provider
- Individual dashboards to clearly communicate sales targets and goals
- Production
- Visualize SQL, ODBC, CSV or RESTful data sources
- Statistical measures and trends of production test results
- Isolate sources of production failures before they impact the bottom line
- Comparison of production lines across factories for efficiency and quality
- Development (DevOps)
- : Gain insights from DevOps, GitHub, CI sources, and more.
|
|
 |
 |